
Network Performance Monitoring: What IT Teams Need to Know
Network performance monitoring (NPM) is the continuous collection, analysis, and reporting of network metrics — including latency, packet loss, bandwidth utilization, and availability — so IT teams can detect, attribute, and resolve performance problems before users are affected. As New Relic defines it, NPM supports proactive incident management by giving operations teams the visibility to act on data rather than complaints. The global NPM market is projected to reach $4.2 billion by 2031, a signal of how seriously organizations are investing in this discipline.
NPM draws from three primary data inputs:
- Flow telemetry (NetFlow, IPFIX, sFlow): conversation-level summaries of who talked to whom, how much, and when
- Packet capture: full or sampled packet data for transaction-level protocol analysis
- Device and endpoint telemetry: SNMP polls, streaming gNMI, and endpoint agents that expose interface counters, CPU, and application-layer timing
Pro Tip: Start with flow telemetry to establish a traffic baseline before adding packet capture.
Key Takeaways
Network performance monitoring works when it combines continuous telemetry collection, percentile-based thresholds tied to service objectives, and correlated investigation workflows that span network, application, and log data.
| Point | Details |
|---|---|
| NPM definition | NPM continuously collects and analyzes metrics like latency, packet loss, and throughput to detect issues before users are affected. |
| Baseline before alerting | Run monitoring for two to four weeks to establish p95/p99 baselines; never set thresholds on averages alone. |
| Correlate time-synchronized indicators | Align NTP across all data sources so NRTT, flow, and error data can be correlated with confidence during incidents. |
| Map metrics to SLA owners | Tie each network KPI to a specific service owner's objective to make alerts credible and budgets defensible. |
| Greatplainsnetworking | Provides 24/7 managed monitoring, baselining, and incident response for SMBs in Norman, Moore, and Oklahoma City with no long-term contracts. |
Table of Contents
- Why does network performance monitoring matter for your business?
- Core network performance metrics: what to monitor and what each reveals
- How NPM collects data: telemetry, flow, packet, and synthetic techniques
- What tool categories should you consider for network monitoring?
- How to set KPIs, map metrics to SLAs, and measure business impact
- Operational best practices for running an effective NPM program
- A research-backed troubleshooting example: using NRTT to find root cause
- Implementation checklist for small and mid-sized organizations
- Common pitfalls and challenges in NPM implementations
- When managed NPM makes more sense than doing it yourself
- Greatplainsnetworking provides 24/7 monitoring for Oklahoma SMBs
- Sources
Why does network performance monitoring matter for your business?
Poor network performance is rarely just a technical inconvenience. When latency spikes on a customer-facing application or a VoIP call breaks up mid-sentence, the business impact is immediate: lost productivity, frustrated customers, and, in regulated industries, potential compliance exposure.
NPM ties directly to several operational priorities:
- User experience: Latency and jitter directly affect application responsiveness. A 200ms round-trip time on an internal ERP system is tolerable; the same delay on a real-time trading platform is not.
- Security and compliance: Anomalous traffic patterns — unexpected flows, unusual port usage, sudden bandwidth spikes — are early indicators of intrusion or data exfiltration. NIST SP 800-137 recommends automated, repeatable monitoring tied to organizational objectives to support risk-based decisions, making NPM a natural feed for information security continuous monitoring (ISCM) programs.
- Capacity planning: Trending bandwidth utilization over weeks and months reveals when a link or segment is approaching saturation — before users notice.
- SLA validation: Without measured baselines and thresholds, SLA disputes become arguments. NPM gives you the timestamped evidence to resolve them.
- Faster troubleshooting: Teams with continuous visibility spend minutes isolating a fault; teams without it spend hours.
Pro Tip: Segment your monitoring by service tier. Business-critical systems — your ERP, VoIP gateway, or patient records application — deserve tighter thresholds and faster alert escalation than guest Wi-Fi or a printer subnet. Prioritizing visibility where it hurts most is where NPM pays off fastest.
For organizations running 24/7 operations or manufacturing environments, continuous monitoring is the difference between catching a failing switch port at 2 AM and discovering it at 8 AM when the shift starts.
Core network performance metrics: what to monitor and what each reveals
Every NPM program rests on a handful of metrics. Understanding what each one signals — and what it does not — prevents misdiagnosis during incidents. RFC 4150's TPM-MIB formalizes how agents expose transaction-level performance measurements and recommends statistical aggregation rather than raw averages for analysis.
The case for percentiles over averages deserves emphasis. Averages hide that tail. For timing metrics, always track p95 and p99 alongside the mean, and watch standard deviation as a stability indicator.
| Metric | Primary Units | What It Indicates | Troubleshooting Next Step |
|---|---|---|---|
| Latency / RTT | Milliseconds (ms) | End-to-end delay; high values suggest congestion, long paths, or device processing delays | Trace the path with traceroute; check interface queues and CPU on intermediate devices |
| Jitter | Milliseconds (ms) | Variation in packet arrival timing; high jitter degrades VoIP and video | Inspect QoS policies; check for competing bulk traffic on shared links |
| Packet loss | Percentage (%) | Dropped packets indicating congestion, errors, or faulty hardware | Check interface error counters; inspect buffers and duplex settings |
| Throughput / bandwidth | Mbps or Gbps | Actual data transfer rate vs. available capacity | Compare to baseline; look for new high-volume flows using NetFlow data |
| Interface errors | Count per interval | CRC errors, input/output drops signaling physical or configuration problems | Inspect cable, SFP, duplex mismatch, or upstream device |
| Availability | Percentage (%) uptime | Whether a device or path is reachable; the foundation of SLA reporting | Verify with synthetic probes; check device logs for reload or failover events |
High p95 latency combined with rising packet loss almost always points to congestion or a hardware fault, not an application bug. That distinction saves hours of misdirected troubleshooting.
How NPM collects data: telemetry, flow, packet, and synthetic techniques
Modern NPM programs pull from several complementary data sources. No single technique covers every scenario, which is why RFC 9232's network telemetry framework defines an architectural taxonomy spanning push and pull models, multiple planes (control, management, forwarding), and protocols including IPFIX and gNMI.
Pull vs. push telemetry
SNMP polling (pull) queries devices on a schedule — typically every 60 or 300 seconds — for interface counters, CPU, memory, and error statistics. It is universally supported and easy to configure, but the polling interval creates blind spots: a 30-second congestion event between polls is invisible.
Streaming telemetry via gNMI (push) sends data continuously from the device to a collector, often at sub-second intervals. It is more accurate for fast-changing metrics but requires modern device support and a capable collector.
Data source comparison
- NetFlow / IPFIX: Exported by routers and switches, these flow records summarize conversations (source/destination IP, port, protocol, byte/packet counts). Best for capacity planning, baselining, and identifying top talkers. Cisco's NetFlow documentation recommends flows for near-real-time monitoring and packet capture for deeper protocol-level analysis.
- sFlow: Samples packets at the hardware level and exports them to a collector. Lower overhead than full NetFlow at high link speeds; good for large-scale environments.
- Packet capture (PCAP): Full fidelity at the packet level. Reveals retransmissions, TCP handshake timing, application errors, and protocol misbehavior. High storage cost; use selectively during investigations.
- Synthetic probes: Scripted transactions that simulate user behavior (HTTP GET, DNS lookup, TCP connect) from fixed vantage points. Measure availability and response time even when no real user traffic is present.
- Endpoint telemetry: Agents on workstations or servers that capture network timing from the application's perspective, including connection setup time and server response time. Particularly useful for remote workers and hybrid environments, as Riverbed notes when describing end-to-end visibility across hybrid networks.
Pro Tip: Use adaptive sampling: run flow export at a low sampling rate (1:1000 or 1:2000) during normal operation to reduce collector load, then switch to 1:100 or full capture during an active incident. Most enterprise routers support dynamic sampling rate changes without a reload.
What tool categories should you consider for network monitoring?
Tool selection follows from what you need to see. The categories below address different operational problems; most mature NPM programs layer two or three of them.
- Flow collectors and analyzers: Ingest NetFlow, IPFIX, or sFlow records to produce traffic reports, top-talker dashboards, and trend data. Best for capacity planning and baselining at scale.
- Packet analyzers: Capture and decode raw packets for protocol-level inspection. Indispensable for diagnosing retransmissions, application errors, and encrypted traffic anomalies (with appropriate decryption keys).
- Full-stack telemetry platforms: Combine device metrics (SNMP/gNMI), flow data, and synthetic results in a single pane. Suited for organizations that need correlated views across network, application, and infrastructure tiers.
- Synthetic testing services: Run scheduled probes from multiple geographic or network vantage points to measure availability and response time independent of real user load. Useful for SLA validation and early detection of regional outages.
- Endpoint monitoring agents: Deployed on user devices or servers to capture network timing from the application layer. Critical for remote work environments where the "last mile" is outside your infrastructure.
| Tool Category | Primary Inputs | Typical Scale | Example Use Case |
|---|---|---|---|
| Flow collector | NetFlow, IPFIX, sFlow | Enterprise to carrier | Identify top bandwidth consumers; baseline utilization trends |
| Packet analyzer | Raw PCAP | Segment or span port | Diagnose TCP retransmissions during application slowdown |
| Full-stack telemetry platform | SNMP, gNMI, flows, synthetic | Mid-market to enterprise | Correlate network latency with application response time |
| Synthetic testing service | HTTP, DNS, TCP probes | Any scale | Validate SLA uptime from external vantage points |
| Endpoint monitoring agent | Application-layer timing | Distributed / remote | Measure user-experienced latency for remote workers |
Cloud migration, SD-WAN, and IoT each shift tool requirements meaningfully. SD-WAN introduces overlay tunnels that obscure traditional flow data; you need tools that understand the overlay and the underlay. IoT devices often lack SNMP support, making synthetic probes and flow-based anomaly detection the primary visibility options. Cloud workloads require cloud-native telemetry (VPC flow logs, cloud provider metrics) alongside on-premises data.
Pro Tip: Before purchasing a full-stack platform, confirm it ingests your existing flow sources natively. Replacing a working flow collector just to consolidate vendors often costs more than it saves in the first year.
How to set KPIs, map metrics to SLAs, and measure business impact
A metric without a threshold is just a number. The process of turning raw network data into a KPI that drives decisions has three steps.
Step 1: Baseline during normal operation. Run your monitoring for two to four weeks without alerts, collecting p50, p95, and p99 values for each metric on each critical path. Document day-of-week and time-of-day patterns. This baseline is your reference point for everything that follows.
Step 2: Set percentile-based thresholds. Avoid setting alerts on averages. A p95 latency threshold of 1.5× your baseline p95 is a defensible, statistically grounded starting point.
Step 3: Map thresholds to service impact. NIST SP 800-137 frames this as making metrics specific, measurable, actionable, relevant, and timely. In practice, that means tying each threshold to a service owner's SLA:
- p95 RTT for the customer-facing API: alert at 150ms, escalate at 250ms
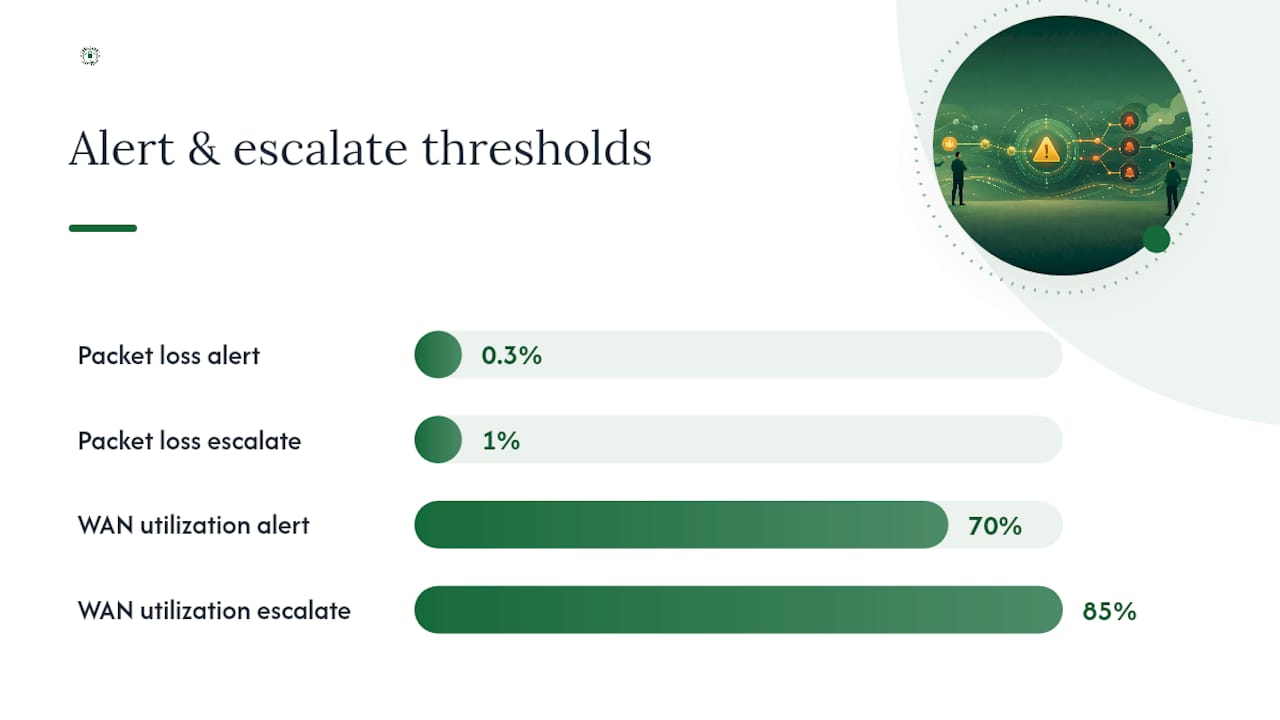
- Packet loss on the VoIP gateway uplink: alert at 0.3%, escalate at 1%
- WAN link utilization: alert at 70% sustained for 15 minutes, escalate at 85%
Measurement frequency and data retention both have practical implications. Five-minute polling intervals are adequate for capacity trending; one-minute or sub-minute intervals are needed for VoIP and real-time application monitoring. Retain raw flow data for at least 30 days for SLA dispute resolution; retain aggregated trend data for 12 months for capacity planning.
Pro Tip: Tie at least one network KPI directly to a service owner's objective — not just "WAN utilization" but "WAN utilization on the link serving the patient scheduling system." That framing gets budget approved and gets alerts taken seriously.
For practical guidance on aligning metrics to business outcomes, IT network optimization for Oklahoma small businesses covers this mapping in a small-business context.
Operational best practices for running an effective NPM program
The difference between an NPM program that works and one that generates alert fatigue comes down to discipline in a few key areas.
- Start small and scope deliberately. Monitor your five most critical services first. Expand coverage only after you have tuned thresholds and confirmed alert quality on the initial scope.
- Automate data collection. Manual polling or ad hoc captures are not a monitoring program. Automate collection, normalization, and storage from day one.
- Tune alerts continuously. Review alert history monthly. Any alert that fires more than twice per week without resulting in a change should be re-evaluated — either the threshold is wrong or the underlying condition is normal.
- Correlate across tiers. Network metrics alone rarely tell the full story. Link NPM data to APM traces and application logs so you can answer "Is it the network or the app?" in minutes rather than hours.
- Govern your data. Define retention policies, access controls, and who owns each alert queue. Telemetry data can be sensitive — flow records reveal internal application topology and user behavior patterns.
- Test your incident workflows. Run a tabletop exercise quarterly: simulate a WAN outage and walk through detection, escalation, and resolution steps. Gaps in the workflow show up in drills, not production incidents.
- Avoid alert storms by grouping related alerts (e.g., all interfaces on a failing switch) into a single parent alert.
- Use time-synchronized indicators — NTP-aligned timestamps across all data sources — so you can confidently correlate a latency spike with a configuration change or a device reload.
- Document your baseline and threshold decisions so new team members understand why thresholds are set where they are.
Pro Tip: Time synchronization is the silent prerequisite for confident attribution. If your network devices, flow collectors, and APM tools are not all synced to the same NTP source, your correlation timelines will be off by enough to create false conclusions during high-pressure incidents.
A research-backed troubleshooting example: using NRTT to find root cause
When users report that an application "feels slow," the first diagnostic question is whether the delay is in the network or the application. Network round-trip time (NRTT) is the metric that answers it.
Broadcom's troubleshooting guidance states that increases in NRTT, particularly when observation counts also rise, are a strong indicator of network-based performance problems. Here is how that plays out in practice:
Detection (T+0): Synthetic probes and endpoint agents report p95 RTT rising from a baseline of 18ms to 95ms on the path between the application server and the primary user subnet. Observation counts are increasing, ruling out a sampling artifact.
Correlate (T+5 minutes):
- Flow data shows a 40% increase in traffic volume on the WAN uplink during the same window.
- Interface error counters on the edge router show rising input drops — a sign of buffer exhaustion.
- Retransmission rates in flow records climb from 0.2% to 3.8%.
Verify (T+10 minutes): A targeted packet capture on the affected segment confirms TCP retransmissions and delayed ACKs consistent with congestion-induced queuing. No application-layer errors appear in the capture, ruling out a server-side fault.
Resolution path: The evidence points to WAN congestion, not an application bug. The team checks QoS policy configuration, identifies a misconfigured traffic class that allowed bulk backup traffic to compete with production, and corrects it. NRTT returns to baseline within two minutes of the fix.
Pro Tip: Preserve packet captures and flow exports from the incident window before you fix the problem. Post-incident analysis is far more reliable when you have the original evidence rather than reconstructed timelines.
The correlation workflow above — NRTT plus flow volume, retransmissions, and interface errors — is exactly what Broadcom recommends for confident network-based attribution.
Implementation checklist for small and mid-sized organizations
Starting an NPM program does not require a six-figure platform. Most SMBs can establish meaningful visibility in 30 days with focused effort.
- Scope your critical services. List the five to ten applications or services where a network outage would immediately affect revenue or operations.
- Inventory your data sources. Confirm which devices support NetFlow/IPFIX export, SNMP, or gNMI. Identify any segments with no telemetry capability (common with older switches or IoT devices).
- Deploy a flow collector and SNMP polling. Even an open-source collector gives you conversation data and device health metrics within hours of configuration.
- Establish a baseline. Run for two to four weeks before setting any alert thresholds. Document p50, p95, and p99 values for each critical path.
- Configure alerts on critical paths only. Start with three to five alerts maximum. Tune before expanding.
- Test your incident workflow. Simulate a failure and confirm that alerts fire, the right person is notified, and escalation paths are clear.
- Review monthly. Check alert history, update thresholds, and expand coverage to the next tier of services.
What to expect by timeline:
- First 30 days: Baseline established, top-talker reports available, first alert tuning cycle complete. Common early finding: a device or link you did not know was saturated.
- First 90 days: Alert quality improves, first SLA report produced, at least one incident resolved faster than before NPM.
- First 180 days: Capacity planning data available for the next budget cycle, correlation workflows between NPM and application logs documented.
If your team lacks the bandwidth to staff monitoring around the clock, or if you are hitting signs that your current IT setup needs an upgrade, that is a clear signal to evaluate managed monitoring options.
Common pitfalls and challenges in NPM implementations
Even well-designed NPM programs run into predictable problems. Knowing them in advance is the most direct way to avoid them.
Data overload is the most common failure mode. Organizations that enable full NetFlow export at 1:1 sampling on every interface quickly overwhelm their collectors and storage. The fix is sampling strategy: start at 1:1000 for baseline visibility, and reserve high-fidelity capture for incident investigation windows.
False positives erode trust faster than almost anything else. An alert that fires every Tuesday morning because of a scheduled backup job is not a monitoring program — it is noise. Alert fatigue causes teams to ignore notifications, which means real incidents go undetected. Threshold governance and regular alert review cycles are the only sustainable remedy.
Blind spots emerge wherever telemetry is absent. Cloud workloads, SD-WAN overlays, IoT devices, and remote endpoints are the most common gaps. Each requires a different telemetry approach: VPC flow logs for cloud, overlay-aware monitoring for SD-WAN, synthetic probes for IoT, and endpoint agents for remote workers. Mapping your coverage gaps during the scoping phase prevents the uncomfortable discovery that your NPM program missed the segment where the incident actually occurred.
Telemetry performance impact is a real concern on older hardware. SNMP polling at 30-second intervals across 500 devices can measurably increase CPU load on constrained switches. Streaming telemetry via gNMI is more efficient at scale, but requires device support. Test polling intervals in a lab or during a maintenance window before rolling out to production.
Skill gaps are underestimated. Reading flow data, interpreting packet captures, and tuning thresholds require specific expertise. Organizations that deploy a monitoring platform without trained staff to operate it often end up with a dashboard no one looks at.
When managed NPM makes more sense than doing it yourself
The honest answer is that in-house NPM is the right call for teams with dedicated network engineers, 24/7 staffing, and the time to tune and maintain a monitoring program. For most small and mid-sized businesses, that description does not fit.
Managed monitoring services make practical sense when your team lacks 24/7 coverage, when you need rapid time-to-value without a multi-month deployment, or when compliance requirements (HIPAA, CMMC, IRS Publication 4557) demand documented monitoring with audit trails that your internal team cannot produce consistently.
The trade-off is real: a managed service costs money that in-house tooling theoretically avoids. But "theoretically" is doing a lot of work in that sentence. The hidden costs of in-house NPM — platform licensing, storage, staff training, after-hours coverage, and the opportunity cost of engineers spending time on monitoring operations rather than projects — often exceed managed service fees within the first year.
Local support and industry-specific compliance knowledge matter more than most buyers realize. A managed service provider that understands HIPAA's requirements for a dental practice or CMMC's controls for a defense contractor brings context that a generic monitoring platform cannot.
When evaluating a managed monitoring contract, validate two things before signing: the SLA for alert response and escalation (how fast does someone act when an alert fires at 3 AM?), and the escalation path when the monitoring team cannot resolve an issue independently.
Pro Tip: Ask any managed monitoring provider for a sample incident report from a real engagement (anonymized). The quality of that report tells you more about their operational maturity than any sales conversation.
Greatplainsnetworking provides 24/7 monitoring for Oklahoma SMBs
For small businesses in Norman, Moore, and Oklahoma City that need continuous network visibility without building an in-house NOC, Greatplainsnetworking delivers 24/7 monitoring, baselining, alert tuning, and incident response as part of its managed IT support offering. No long-term contracts, no jargon-heavy reports — just documented visibility and same-day response when something needs attention.

A typical engagement starts with a network health assessment that maps your current infrastructure, identifies telemetry gaps, and establishes a performance baseline. From there, Greatplainsnetworking configures continuous monitoring with thresholds tuned to your specific services, produces monthly performance reports, and handles incident escalation so your team is not on call at midnight. For law firms, dental practices, and other regulated businesses, the monitoring program is documented to support HIPAA and CMMC compliance requirements. Contact Greatplainsnetworking to request your network health assessment and get a clear picture of where your network stands today.
Sources
The standards and references below are the primary technical foundations for any NPM program. Each one is worth bookmarking.
- Troubleshooting Increased Network Round Trip Time (NRTT) — Broadcom
- NIST Special Publication 800-137 — Information Security Continuous Monitoring (ISCM)
- What is Network Performance Monitoring? (New Relic)
Recommended
Want help putting this into practice?
We'll audit your security, speed, and hardware in under an hour — no commitment, no sales pitch. Just a clear roadmap of what to fix and why.